Be in The Know
🍪 Publishers are continuing to test cookieless alternatives despite Google’s announcement.
🥤 Olipop is betting on the sports marketing space.
🤫 For the first time in Olympics history, a commercial-free hour will simply feature rotating brand logos.
🤷 When are search and shopping ads coming to Google’s AI Overviews? Soon.
🤣 CrowdStrike sent out $10 Uber Eats gift cards to apologize for the outage, but they didn’t work.
Hootsuite’s Social Benchmarks by Industry
👀 Sponsor this spot to share your content with our community.
Let’s get into Hootsuite’s 2024 Social Benchmarks:
Education
- Facebook Page impressions: 817,000
- Facebook audience growth rate: -0.93%
- Average Facebook post engagement rate: 1.45%
- Facebook posting frequency: 0.45 posts/day
- Instagram profile impressions: 1.0 million
- Instagram audience growth rate: 7.42%
- Average Instagram post engagement rate: 2.21%
- Instagram posting frequency: 0.88 posts/day
Entertainment and Media
- Facebook Page impressions: 5.4 million
- Facebook audience growth rate: -3.83%
- Average Facebook post engagement rate: 0.99%
- Facebook posting frequency: 1.78 posts/day
- Instagram profile impressions: 3.2 million
- Instagram audience growth rate: 3.09%
- Average Instagram post engagement rate: 1.94%
- Instagram posting frequency: 1.25 posts/day
Financial Services
- Facebook Page impressions: 858,000
- Facebook audience growth rate: -0.84%
- Average Facebook post engagement rate: 0.91%
- Facebook posting frequency: 0.25 posts/day
- Instagram profile impressions: 724,000
- Instagram audience growth rate: -5.91%
- Average Instagram post engagement rate: 2.00%
- Instagram posting frequency: 0.35 posts/day
Food and Beverage
- Facebook Page impressions: 1.5 million
- Facebook audience growth rate: -12.39%
- Average Facebook post engagement rate: 0.66%
- Facebook posting frequency: 0.3 posts/day
- Instagram profile impressions: 949,000
- Instagram audience growth rate: -3.53%
- Average Instagram post engagement rate: 1.54%
- Instagram posting frequency: 0.81 posts/day
Retail
- Facebook Page impressions: 2.2 million
- Facebook audience growth rate: -5.14%
- Average Facebook post engagement rate: 0.72%
- Facebook posting frequency: 0.33 posts/day
- Instagram profile impressions: 2.2 million
- Instagram audience growth rate: -2.72%
- Average Instagram post engagement rate: 1.62%
- Instagram posting frequency: 0.95 posts/day
Check out the full report for more industry benchmarks.
Smash or Pass 👍 / 👎
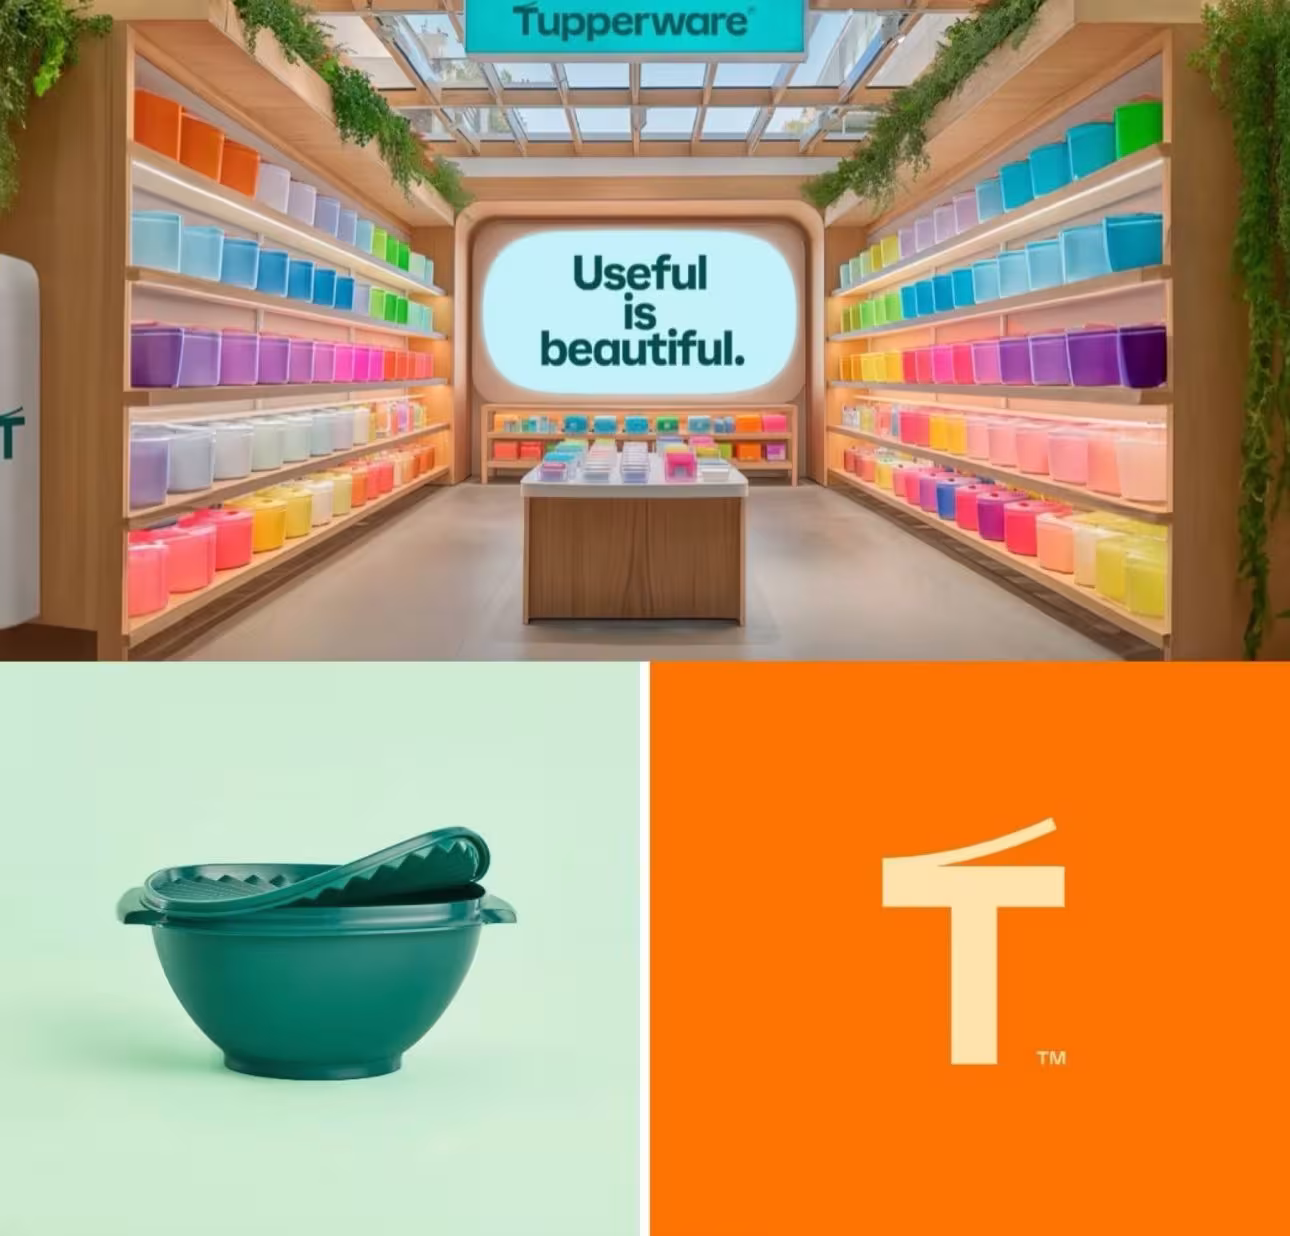
Tupperware gets a major refresh and a clever initial monogram.
Inbox Report
👀 Sponsor this spot to share your product or resource with our community.
You’re busy. But are you busier than 75% of professionals?
Inbox Report is a free tool that gives you a detailed analysis of your activity, like how many emails you’ve received in a set timeframe, and how your inbox stacks up against those of your peers.
There’s a lot you could do with this information, but if nothing else, it’s likely to perform well as a LinkedIn post.
Btw, your emails aren’t stored or read—just counted.
Classifieds
Place a Classified Ad in a Friday edition of The Daily Carnage for just $99.
What you get:
- 200 characters 📣
- An internal link 🔗
- Your ad lives on our site indefinitely 💛
Let’s get it on the calendar.
Mass A-Peel
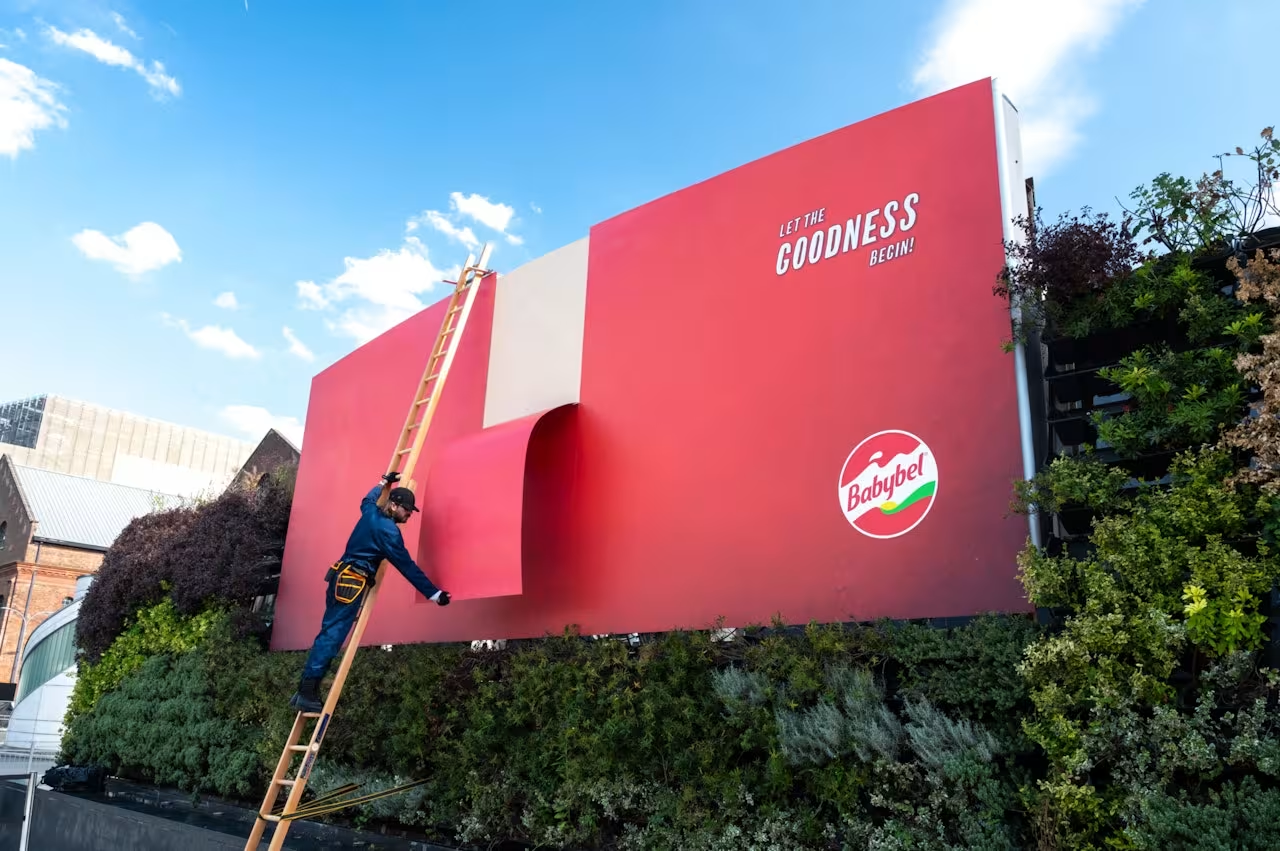
Babybel put up a 3D peelable billboard in the UK.
They even hired an actor to stand on a ladder and do the honors.
There’s not much more to say. It’s perfect and we love it.
Ads from the Past
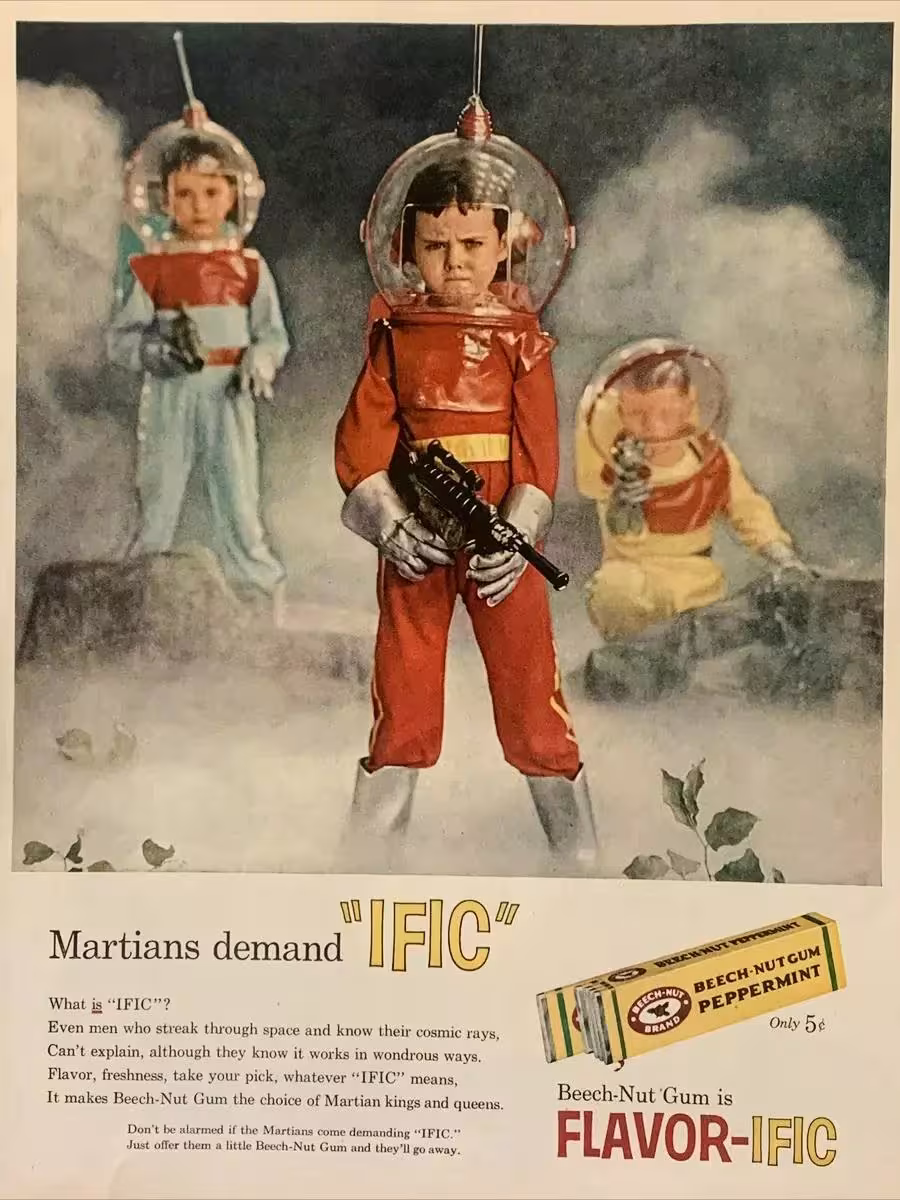
Beechnut Gum, 1950s